

To calculate sample size for a study, define the primary outcome and planned analysis, choose a scientifically meaningful effect, estimate variability or event rates, and set significance level, power and allocation. Calculate the analyzable sample, round upward, then allow for dropout. There is no single sample size formula that fits every study.
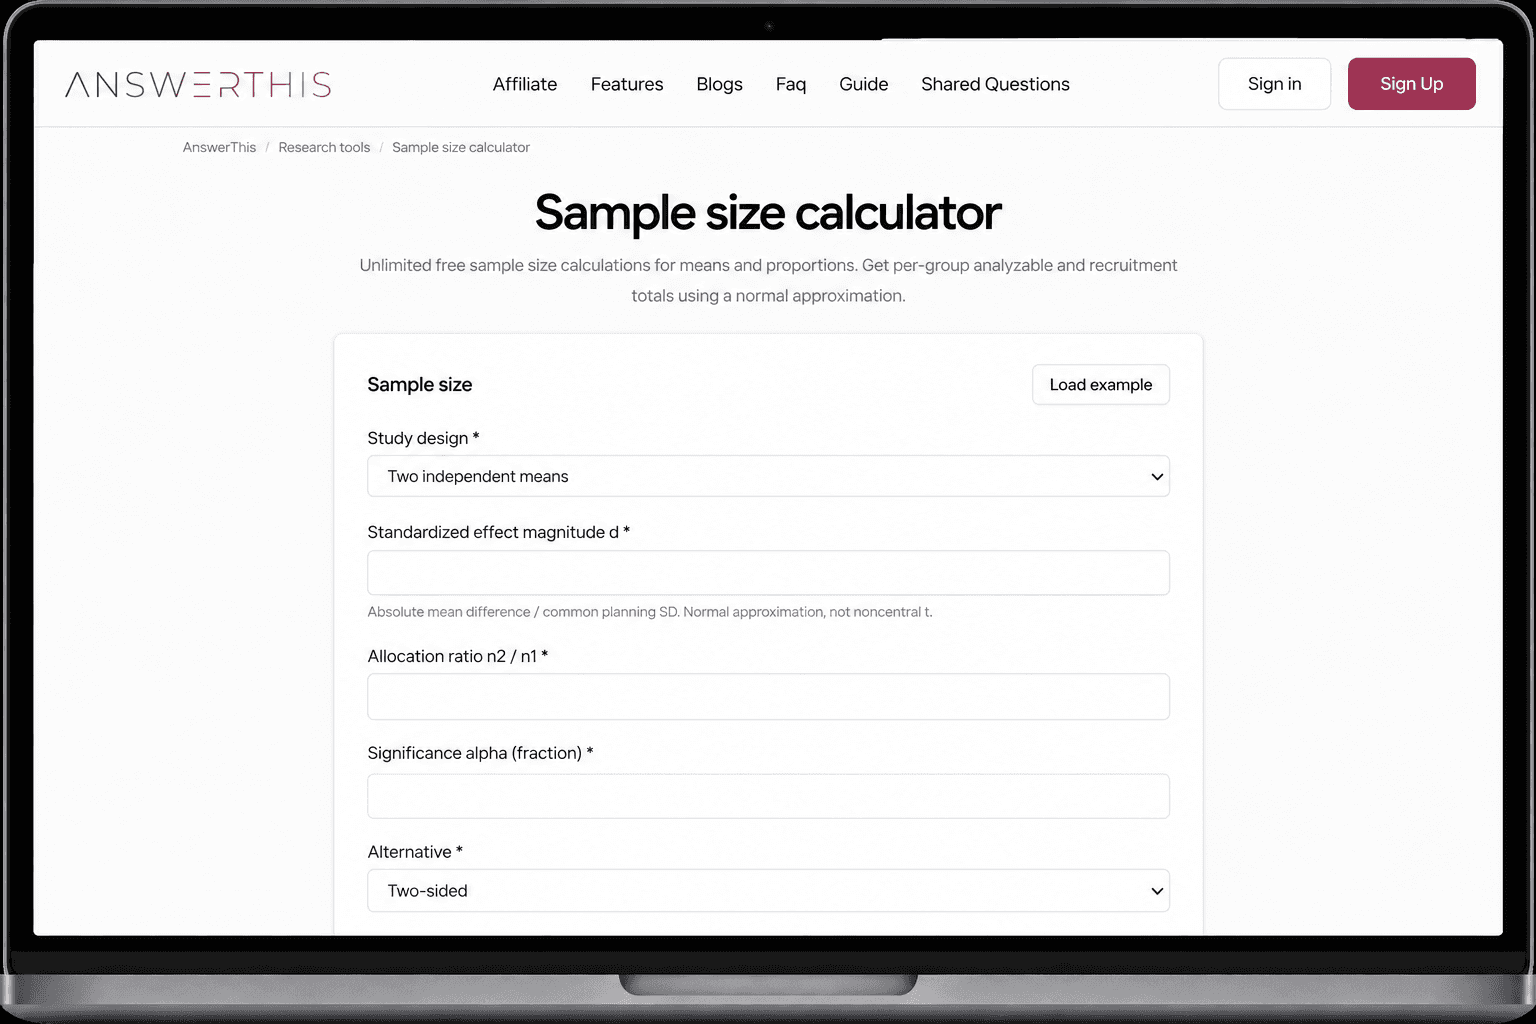
Use the AnswerThis sample size calculator for an initial normal-approximation calculation for supported means and proportions designs. A study statistician should confirm the final design; this guide explains what to enter, how to interpret the result and when to use another method.
TL;DR
Calculate sample size from the outcome, design, meaningful effect, variability, alpha, power and expected loss to follow-up.
AnswerThis supports initial normal-approximation planning for five simple means and proportions designs, not every study design.
Paired measurements require the SD of within-person differences, not the independent-groups pooled SD.
Prespecify assumptions, test smaller plausible effects and export the calculation before committing to recruitment.
What is sample size, and what decides it?
Sample size is the number of independent units included in a study’s analysis. The required number depends on the research question, design, outcome variability, meaningful effect, significance level and desired power. Recruitment also depends on expected missing outcomes. Repeated measurements of one person do not automatically count as additional independent participants.
Specify the unit first: participants, complete pairs, schools or another independent unit. A paired study with 32 people measured twice has 32 complete pairs, not 64 independent participants. Distinguish the number approached, the number recruited and the number whose outcomes can be analyzed.
A hypothesis-testing study is planned to detect a specified effect. A descriptive survey may instead be planned for a confidence interval with a chosen margin of error. A feasibility study can have a different justification again. Choose the objective before choosing a calculator; “30 participants” is not a universal rule.
The inputs: effect size, variability, significance level, power and dropout
Write the assumptions in a planning sheet before entering numbers. Each assumption should have a reason, a supporting source where available and a sensitivity scenario.
Primary outcome and design
What it means: The comparison the study will answer
What to enter or document: Outcome, units, time point; independent groups, paired measurements or one sample
Common mistake: Selecting a formula from the total headcount alone
Effect size
What it means: The difference or association worth detecting
What to enter or document: Raw mean difference and planning SD, or the two expected event probabilities
Common mistake: Choosing a large effect merely to reduce recruitment
Variability
What it means: Spread of the outcome or within-person changes
What to enter or document: Common planning SD for independent means; difference-score SD for paired means
Common mistake: Substituting a standard error for an SD
Significance level, alpha
What it means: Type I error criterion under the specified test
What to enter or document: For example, 0.05; one- or two-sided, decided in advance
Common mistake: Changing to one-sided after seeing the result
Statistical power
What it means: Probability of rejecting the null under a specified alternative
What to enter or document: For example, 0.80 or 0.90, with a scientific justification
Common mistake: Interpreting 80% power as an 80% chance the hypothesis is true
Allocation
What it means: Relative analyzable group sizes
What to enter or document: n2/n1; 1 means equal allocation
Common mistake: Assuming an unequal split is equivalent to an equal split
Dropout or missing outcomes
What it means: Expected proportion without usable primary outcomes
What to enter or document: A justified loss fraction, separately by group if needed
Common mistake: Adding 10% instead of dividing by 0.90
For independent means, the standardized planning effect is d = absolute mean difference / common planning SD. For paired means, use dz = absolute mean within-pair difference / SD of the differences. These denominators are not interchangeable.
For a two-sided, equal-allocation normal-approximation comparison of two means, a useful approximate formula is:
Here z(q) is a standard-normal quantile and ceiling means round up to the next whole participant. With alpha 0.05 and power 0.80, the quantiles are approximately 1.96 and 0.842. This shortcut is not a small-sample t-test calculation. AnswerThis solves its stated normal-power equation numerically, including both rejection tails for a two-sided test.
If your objective is estimating a single proportion, a different simple-random-sampling approximation is n ≈ z² × p × (1 − p) / E², where E is the desired absolute margin of error and p is the planning proportion. It is not the formula for testing a difference between two groups. Population corrections, sampling weights and clustered sampling require additional consideration.
Effect size explained: Cohen’s d, Hedges’ g, odds ratios and r
Effect size describes the magnitude of a difference or association; a p-value does not. State both the measure and its scientific meaning. A difference in symptom-score points or an absolute event-risk difference can be more interpretable than a standardized label.
Cohen’s d
Meaning and calculation: Independent-group mean difference divided by pooled SD
Main interpretation limit: The SD and group ordering affect the number; direction does not imply benefit
Hedges’ g
Meaning and calculation: Cohen’s d multiplied by a small-sample bias correction
Main interpretation limit: Corrects estimation bias; does not replace small-sample power planning
Paired dz
Meaning and calculation: Mean within-pair difference divided by difference-score SD
Main interpretation limit: Depends on within-person correlation; not interchangeable with independent d
Paired dav
Meaning and calculation: Mean difference standardized by average condition variance
Main interpretation limit: Uses a different denominator from dz
Odds ratio
Meaning and calculation: Ratio of event odds between groups
Main interpretation limit: Not a risk ratio; needs baseline risk for an absolute-risk interpretation
Pearson r
Meaning and calculation: Strength and direction of linear association, from −1 to 1
Main interpretation limit: Does not establish causation; nonlinear patterns and outliers matter
What counts as a large Cohen’s d?
Cohen’s conventional benchmarks are 0.2 small, 0.5 medium and 0.8 large, applied to magnitude rather than sign. They are reference points, not clinical thresholds. A small standardized effect can be important for a serious outcome; a large one can concern an outcome that matters little.
Lakens’ methodological primer explains why effect-size definitions and standardizers must match the design, and why benchmarks should not be interpreted rigidly. Use relevant prior evidence and the smallest scientifically important difference rather than a generic “medium” assumption.
The AnswerThis effect size calculator calculates Cohen’s d, Hedges’ g, paired dz and dav, odds ratios and Pearson r. It provides confidence intervals for odds ratios and r, not for d or g. It also includes specified t-to-d and approximate d–r conversions; those conversions are not universal across designs.
Statistical power and power analysis: how much power a study needs
Statistical power is the probability that a specified test rejects the null hypothesis when a particular alternative effect is true. Power analysis connects effect size, sample size, alpha and the test’s assumptions. An a priori analysis solves for the sample before recruitment; a sensitivity analysis can identify the effect a feasible sample can detect.
An 80% target means a 20% probability of failing to reject the null under that particular alternative and model. It does not describe the probability the research hypothesis is correct. Targets of 80% and 90% are common planning choices, not guarantees or universal requirements. Choose the target based on the consequences of a missed effect, feasibility and the study’s purpose.
Increase the assumed variability or reduce the effect worth detecting, and the required sample generally increases. Raising target power or tightening alpha also increases requirements under otherwise unchanged simple designs. Multiple primary tests need an explicit error-control plan, not repeated independent calculations at 0.05.
Use the AnswerThis power analysis calculator to explore achieved power for a prespecified effect and analyzable counts under its normal approximation. After a study, power computed from its observed effect is generally uninformative. Interpret the effect estimate, confidence interval, study limitations and analysis instead.

Worked examples: two groups, paired measurements and two proportions
The following are hypothetical teaching scenarios, not evidence about any intervention. Outputs were checked in the live AnswerThis sample size calculator on 5 October 2026. All use two-sided alpha 0.05 and target power 0.80. They demonstrate the calculator’s normal approximation, not a final approved study design.
How do I calculate sample size for a study? Follow these steps
Define the primary outcome and analysis. Specify its units, measurement time, independent unit and planned comparison.
Choose a meaningful effect and variability. Record the evidence supporting the difference, planning SD or event rates.
Set alpha, power, sidedness and allocation. Make these decisions before seeing the sample-size output.
Calculate and round the analyzable sample. Use a method that matches the design and report per-group counts or complete pairs.
Allow for missing outcomes. Divide each analyzable target by one minus the expected loss fraction and round upward again.
Check sensitivity and obtain statistical review. Test smaller plausible effects or greater variability, export assumptions and confirm the final plan.
Example 1: two independent groups
Assume a meaningful mean difference of 5 score points and a common planning SD of 10 points. The standardized effect is d = 5/10 = 0.5. Choose Two independent means, enter effect 0.5, allocation 1, alpha 0.05, two-sided, power 0.80 and attrition 10%.
The result is 63 analyzable participants per group: 126 total. Recruitment becomes ceiling(63/0.90) = 70 per group, or 140 total. Achieved normal-approximation power at the rounded analyzable counts is 0.801302.
The shortcut formula gives about 62.79 per group before rounding. A noncentral-t implementation can give a different target because the analysis estimates variance. Do not treat the normal result as a validated small-sample t-test plan.
Example 2: paired measurements
Assume a meaningful average within-person change of 3 score points and a difference-score SD of 6 points. Then dz = 3/6 = 0.5. Select Paired means and use the same alpha, sidedness, power and 10% attrition settings.
The result is 32 complete pairs, with a recruitment target of ceiling(32/0.90) = 36 participants. Achieved normal-approximation power is 0.80743. Each person must supply the measurements needed for a complete pair; count participants once.
Do not enter the SD at baseline or follow-up unless it is genuinely the SD of the differences. This example is particularly important to confirm with paired-t planning software because 32 pairs is a modest sample and the normal method does not use a t distribution.
Example 3: two independent proportions
Assume event probabilities of 0.20 and 0.10 at the same follow-up time. Select Two independent proportions, enter these probabilities, allocation 1, alpha 0.05, two-sided, power 0.80 and attrition 10%.
AnswerThis uses Cohen’s arcsine-transformed effect:
The magnitude is approximately 0.283794. The result is 195 analyzable participants per group: 390 total. Recruitment is ceiling(195/0.90) = 217 per group, or 434 total; achieved normal-approximation power is 0.800185.
This is not an exact binomial calculation or an untransformed risk-difference method. Another calculator can disagree because it uses another test, variance model or continuity correction. Compare methods, not just totals, especially when events are sparse.
Why smaller effects need larger samples
Holding design, alpha, power and allocation fixed in the independent-means normal approximation, the sample scales approximately with 1/d². Halving the effect therefore requires about four times as many observations before rounding.
The live calculator gives 25 per group at d=0.8, 63 at d=0.5, 99 at d=0.4 and 393 at d=0.2. These use equal allocation, two-sided alpha 0.05, power 0.80 and no attrition. The accompanying chart shows that nonlinear increase; the small-sample end remains subject to the t-planning warning.
What to report: the CONSORT and ICH E9 requirements
Report how the sample was determined, not just the final target. CONSORT applies to reports of randomized trials; it is not a universal requirement for every student project. ICH E9 addresses statistical principles for clinical trials in drug development, not a blanket compliance label for a calculator.
CONSORT 2025 item 16a calls for the sample-size determination and all supporting assumptions; item 16b covers interim analyses and stopping guidelines. The CONSORT 2025 statement is the current version checked for this guide. SPIRIT 2025 provides the corresponding protocol-planning guidance.
ICH E9, section 3.5, addresses sample-size planning. Document the calculation method and assumptions, justify the target effect and examine sensitivity to departures from assumptions. For regulatory studies, align planning with the defined treatment effect and analysis; the E9(R1) estimand framework adds clarity about what effect is being estimated.
Use this reporting checklist:
Primary outcome, units, time point, independent unit and planned statistical test.
Target difference and justification; planning SD or group event rates, with their sources.
Alpha, sidedness, power, allocation and any multiplicity adjustments.
Analyzable counts, missing-outcome assumptions and recruitment targets by group.
Formula or software, version or implementation date, rounding rules and sensitivity scenarios.
Any prespecified interim analyses, stopping rules or sample-size re-estimation approach.
For these teaching examples, cite the calculator method implementation dated 14 September 2026, rather than inventing a launch date. Its pages state numeric reference validation against SciPy 1.15.3, statsmodels 0.14.4 and pingouin 0.5.5; that statement is not a claim of regulatory approval.
A reporting template is: “We planned to compare [primary outcome at time point] using [analysis]. We assumed [target effect and variability/event rates], based on [source], with [alpha and sidedness], [power] and [allocation]. This required [analyzable counts]. Allowing for [loss assumption] gave [recruitment counts]. We used [method/software/version] and examined [sensitivity scenarios].”
When to use specialist software or a statistician
AnswerThis supports two independent means, paired means, a one-sample mean, two independent proportions and a one-sample proportion using a labeled normal approximation. Its sample-size and power tools do not cover cluster randomization, survival endpoints, regression power, equivalence, non-inferiority, sequential monitoring or complex longitudinal designs.
Small-sample mean comparison
Suitable next step: Validated noncentral-t planning and statistical review
Why a simple calculation is insufficient: Variance estimation affects the reference distribution
Cluster-randomized study
Suitable next step: Cluster-specific software or simulation
Why a simple calculation is insufficient: Within-cluster correlation and cluster sizes determine information
Survival endpoint
Suitable next step: Time-to-event planning with a statistician
Why a simple calculation is insufficient: Event count, accrual, censoring and follow-up matter
Non-inferiority or equivalence
Suitable next step: Design-specific planning with justified margins
Why a simple calculation is insufficient: Hypotheses and margins differ from a superiority test
Sequential or complex longitudinal design
Suitable next step: Specialist software or simulation matched to the analysis
Why a simple calculation is insufficient: Monitoring rules and correlation structure change operating characteristics

Is there a free sample size or power analysis calculator?
Yes. AnswerThis’s sample-size, power-analysis and effect-size calculators are free and unlimited with no login. Numeric inputs stay in the browser; these calculations use no AI model or external calculation service. Inputs and results are not saved or transferred to AnswerThis, so copy or export the text or CSV with assumptions before leaving.
G*Power’s official university page provides free desktop software for many t, F, chi-square, z and some exact tests. Select the matching test and record the software version; free software does not remove the need to justify assumptions or obtain design review.
AnswerThis calculators
Best for: Initial browser-based planning for the five supported means and proportions designs; local calculations without login
Important limitation: Sample-size and power results use a normal approximation, not noncentral-t or complex-design planning
G*Power
Best for: Desktop power analysis for its supported t, F, chi-square, z and exact tests
Important limitation: You must select the matching statistical test and justify its assumptions; availability does not establish design suitability
What does a p-value tell you?
A p-value is the probability, assuming the null hypothesis and specified statistical model, of a test statistic at least as extreme as the observed statistic. It is not the probability that the null is true, the chance that a result is “random,” or the size or importance of an effect.
To calculate it, choose the prespecified test, calculate its statistic and use the appropriate null distribution and sidedness. A z-score calculator is not a substitute for a t, exact or design-specific analysis. The American Statistical Association’s statement cautions against conclusions based only on crossing a p-value threshold. Report the effect and confidence interval alongside the test result.
How do I calculate the number needed to treat?
For a harmful outcome prevented by treatment, calculate ARR = control risk − treatment risk, then NNT = 1/ARR, using risks as fractions over the same follow-up period. In a hypothetical example with control risk 0.20 and treatment risk 0.10, ARR is 0.10 and NNT is 10: ten people treated rather than given the comparator for one additional expected prevented event during that period.
Round a non-integer NNT upward. An absolute risk increase describes additional harm rather than benefit. NNT is not the sample size required for a trial, and an odds ratio alone does not supply it without baseline risk. If the risk-difference interval crosses zero, an NNT interval involves infinity and needs careful interpretation. Cochrane Handbook chapter 15 explains these limitations and the need to state the event, comparator and time horizon.
FAQs
How do I calculate the sample size for my study?
Define the primary outcome and design, choose a meaningful effect and variability or event rates, set alpha, power and allocation, then calculate the analyzable sample and inflate for missing outcomes. Use a method that matches the planned analysis and have a statistician confirm the final design.
What is sample size?
Sample size is the number of independent units in the analysis. In a paired study, report complete pairs; repeated measurements on one participant are not automatically independent participants.
What is a power analysis, and what is statistical power?
Power is the probability of rejecting the null hypothesis under a specified alternative effect and model. Power analysis connects effect size, sample size, significance level and the test; 80% power is not an 80% probability that a hypothesis is true.
What is effect size, and what counts as a large Cohen’s d?
Effect size describes the magnitude of a difference or association. Cohen’s conventional d benchmarks are 0.2 small, 0.5 medium and 0.8 large, but scientific importance depends on the outcome, population and relevant evidence.
What role do AnswerThis’s calculators play in sample size planning?
AnswerThis’s sample size calculator estimates analyzable and recruitment counts, its power analysis calculator explores achieved power for a prespecified effect, and its effect size calculator helps calculate the magnitude of differences or associations. These tools offer free, unlimited local calculations without login; results are not saved or transferred to AnswerThis. Sample-size and power calculations use a labeled normal approximation for supported means and proportions designs, so a statistician should confirm the final study design.
One last thing
The most important input is often the least certain one: the effect worth detecting. Save a sensitivity analysis with the central calculation. An exact-looking recruitment total cannot make an optimistic effect assumption reliable.


